Archive for the ‘Satellite TV’ Category

Scientists Sky-High Over First CloudSat Images
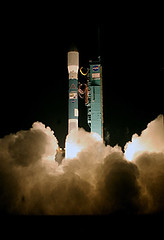
Thursday, June 8th, 2006

Last month we wrote about the launch of the CloudSat and Calipso satellites. Now reports are coming back that the first images from Cloudsat are giving scientists a completely new view of the clouds:


"We’re seeing the atmosphere as we’ve never seen it before," says Deborah Vane, CloudSat deputy principal investigator at NASA’s Jet Propulsion Laboratory in Pasadena, California, US. "We’re no longer looking at clouds like images on a flat piece of paper, but instead we’re peering into the clouds and seeing their layered complexity…."

CloudSat’s Cloud Profiling Radar, the first millimetre-wavelength radar, underwent tests in late May and was formally activated on 2 June.

"All major cloud system types were observed, and the radar demonstrated its ability to penetrate through almost all but the heaviest rainfall," says Graeme Stephens, CloudSat principal investigator and atmospheric scientist at Colorado State University, US.

The first image is a cross-section of a warm storm front above the Norwegian Sea taken on 20 May. In the image, red represents highly reflective particles such as raindrops, ice crystals or snowflakes. Blue represents thinner cirrus clouds.

The radar also provided a look at a night snow storm near Antarctica. The long winter nights make traditional remote sensing difficult in the polar regions and CloudSat is the first satellite able to detect snowfall from space.

A third image shows tall thunderstorm clouds over east Africa.

The results are still preliminary, but the mission team aims to release validated science data within nine months.

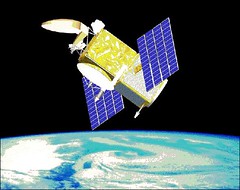
CloudSat is part of the A-Train, a constellation of five satellites that fly right behind one another, measuring the same swath of Earth.

The picture above is "CloudSat’s first image, of a warm front storm over the Norwegian Sea, was obtained on May 20, 2006. In this horizontal cross-section of clouds, warm air is seen rising over colder air as the satellite travels from right to left. The red colors are indicative of highly reflective particles such as water droplets (or rain) or larger ice crystals (or snow), while the blue indicates thinner clouds (such as cirrus). The flat green/blue lines across the bottom represent the ground signal. The vertical scale on the CloudSat Cloud Profiling Radar image is approximately 30 kilometers (19 miles). The blue line below the Cloud Profiling Radar image indicates that the data were taken over water."

For more information on Cloudsat, visit the NASA CloudSat website.

Jason-2 in Space

Tuesday, June 6th, 2006

It has nothing to do with Wes Craven and is not nearly as scary as it sounds: new details have been released about the Jason-2 (Joint Altimetry Satellite Oceanography Network) satellite set to be launched from Vandenberg AFB in October 2008. In a demonstration of international cooperation in global warming research, the Japan Aerospace Exploration Agency is working with the French company CNES on the project:

The science objectives of Jason-2/OSTM are to extend the time series of ocean surface topography measurements to: a) obtain a continuous record of observations (with the previous missions), b) to determine the variability of ocean circulation at decadal time scales from combined data record with T/P and Jason, c) improve the measure of the time-averaged ocean circulation, d) improve the measure of global sea-level change, and e) improve open ocean tide models.

The mission objectives call for the provision of the same measurement accuracy of Jason (3.3 cm) with a goal of achieving 2.5 cm, and to maintain the stability of the global mean sea level measurement with a drift less than 1 mm/year over the life of the mission. The overall goal is to better understand the forces behind global changes of climate and to predict seasonal anomalies in weather patterns; this is vital to understand the physics of the ocean.

Jason-2 is scheduled to join Jason-1 in the same orbit with a 10 day repeat observation cycle. Both satellites will pass within minutes of each other over the same ocean surface, thus enabling verification and cross-calibration of the collected data. Together, they will provide a vital contribution to the expanding network of global ocean observations and their application in meteorology, operational oceanography and climate monitoring.


Flying Robots to Patrol Europe?

Monday, June 5th, 2006

Remember those flying robots we told you about earlier, and how Europe has some of their own. Well, now EU plans on putting those airborne bots to work

uav

Fleets of unmanned "drone" aircraft fitted with powerful cameras are to be used to patrol Europe’s borders in a dramatic move to combat people-smuggling, illegal immigration and terrorism.

The Independent on Sunday can today reveal that the tiny planes will fly at more than 2,500 feet over the English Channel and Mediterranean beaches as part of a £1bn programme to equip Europe’s police forces, customs officers and border patrols with hi-tech surveillance and anti-terrorism equipment.

The aircraft, called unmanned aerial vehicles (UAVs), are already being used by the Belgian government to catch tankers illegally dumping oil in the North Sea. Several ships’ captains have already been prosecuted.

The European Commission now wants to use similar drones, which can have a 6-metre wing-span and weigh as little as 195kg, to patrol the Mediterranean coasts and the Balkans where illegal immigrants try to enter the EU. The Russian government is also close to flying drones over its borders.

Interesting news, but if you ask me they’ll only really be on to something when the put tentacles on those flying robots.

Using Satellites to Track Human Rights Abuses

Wednesday, May 31st, 2006

We’ve written before about scientists using satellites to track climate change and uncover Mayan ruins. Now scientists and activists are using satellites for another purpose– to spot human rights abuses:

Satellite images captured under a pioneering program of the American Association for the Advancement of Science (AAAS) provide powerful evidence that the government of Zimbabwe has destroyed an entire settlement and relocated thousands of residents as part of a campaign against political opponents.

The images, analyzed by the AAAS staff, show two views of the settlement of Porta Farm, located just west of the Zimbabwean capital of Harare. The first, an archived image from June 2002, shows an intact settlement with more than 850 homes and other buildings; an estimated 6,000 to 10,000 people lived in Porta Farm at the time. The second photo, taken by satellite on 6 April this year, shows that the settlement has been leveled.

The pictures were released Wednesday 31 May as central evidence in a report compiled by the international secretariat of Amnesty International in London and Zimbabwe Lawyers for Human Rights (ZLHR), based in Harare. The report, “Shattered Lives: The Case of Porta Farm,” views the destruction of the settlement and the forced relocation of its residents as emblematic of a broad campaign by the government of President Robert Mugabe to repress political opposition.

(Via Kottke.) 

Comet Cancelled?

Thursday, May 25th, 2006

What’s that in the sky? A bird? A plane? Well, no. It’s a comet, but nothing you need to worry about according to Phil over at Bad Astronomy.

Comet

Well, today is the day, once again, that the world won’t end. I’m shocked, shocked, that the comet fragment predicted to hit in the Atlantic causing a seismic event and an ensuing tidal wave hasn’t materialized.

Of course, the day’s not over yet. But I’m pretty sure how this will turn out.

Chris has been blogging the story of whether or not a comet will hit the earth today, and is pretty sure it won’t. He’s updated his post about his Sirus Radio interview on the subject with more than enough links to make an effective case. 

But keep one eye on the sky today just in case, will ya?

Map of the Known Universe

Tuesday, May 16th, 2006

Astronomers have released the largest-ever atlas of the cosmos — and it’s coming soon to the world wide web.

The Royal Astronomical Society reports:

Traditionally, astronomers have needed to take a "spectrum" of each galaxy to determine [the distance between galaxies], splitting its light into many components to reveal sharp features with which to measure the amount of redshifting. This requires a time-consuming, individual observation of each galaxy.

The new cosmic map has been constructed using a novel technique focusing on a special class of galaxy whose intrinsic colour is very well known. For these ‘Luminous Red Galaxies’ researchers can measure the amount of colour distortion, and hence the approximate distance of the galaxy, just by looking at digital images of the sky, without the need to obtain a full spectrum.


What is most striking is that the new study and atlas have revealed that "the ordinary matter our bodies are made of and that we experience in everyday life only accounts for a few percent of the total cosmic budget:"

Our Universe contains billions of galaxies of all shapes and sizes. In recent years astronomers have used increasingly large surveys to map out the positions of these galaxies, stepping their way out into the Cosmos.

The new cosmic map unveiled today is the largest to date — a three-dimensional atlas of over a million galaxies spread over a distance of more than 5 billion light years. The findings confirm that we live in a Universe filled with mysterious dark matter and dark energy.
"We have analyzed the patterns in this map and discovered waves of structure over a billion light years across," said Dr. Chris Blake of the University of British Columbia, principal author of the study. "These waves were generated billions of years ago and have been vastly stretched in size by the expanding Universe."
 
The full findings of the report can be found here.

Science Mythbusting

Monday, May 1st, 2006

Over on Newsvine, I came across an interesting post by someone who claims to be busting the myths about science, and found a couple of interesting items on the list.

Myth 2. The Great Wall of China is the only manmade structure visible from space

There are several variations on this folkloric statement, and they’re all quantifiably false. Astronauts can spot the Great Wall from low-Earth orbit, along with plenty of other things like the Giza pyramids and even airport runways. But they can’t see the Wall from the Moon. 

Myth 12. There is no gravity in space

Blame the term "zero-gravity" for this common misconception. Gravity is everywhere, even in space. Astronauts look weightless because they are in continuous freefall towards the Earth, staying aloft because of their horizontal motion. The effect of gravity diminishes with distance, but it never truly goes away. It is also untrue that space is a vacuum. There are all kinds of atoms out there, albeit sometimes far apart. 

I don’t know about the gravity question (any physicists out there?), but apparently our mythbuster is dead on about the Great Wall.

“You can see the Great Wall,” Lu says. But it’s less visible than a lot of other objects. And you have to know where to look.

In fact stretches of the wall aren’t even visible from China. They’ve been buried by sand for centuries. NASA has used space-based radar to map out hidden parts of the ancient structure. [Astronaut Ed] Lu is trying to get a picture of it, too, with a digital camera. 

I don’t know if Lu every got his picture, but I did track down the pictures NASA took with its "space-based radar." 

The mythbuster also takes on some common myths about asteroids.

Weather Satellites Launch After Weather Delays

Monday, May 1st, 2006

Seventh time’s the charm, right?


After six tries over eight days, NASA launched a Delta 2 rocket Friday and a pair of satellites that will give planet Earth its newest health checkup by examining the secrets of clouds.

The 12-story-tall rocket built by Boeing rumbled off Space Launch Complex-2 at 3:02 a.m. into foggy skies at Vandenberg Air Force Base.

The approximately $515 million mission placed two satellites into orbit: CloudSat and CALIPSO (Cloud-Aerosol Lidar and Infrared Pathfinder Satellite Observations). About 90 minutes later, officials confirmed that the satellites had arrived in space.

“With the successful launch of CloudSat and CALIPSO we take a giant step forward in our ability to study the global atmosphere," said David Winker, CALIPSO principal investigator from NASA’s Langley Research Center, Va. "In the years to come, we expect these missions to spark many new insights into the workings of Earth’s climate and improve our abilities to forecast weather and predict climate change."

 We wrote about the launch in anticipation on the 20th of April; Rocco kept us updated in the comment threads ("CloudSat can’t launch because of clouds. Go figure."); but now the wait is over, and you can view Friday’s successful launch here.

COSMIC Launch

Monday, April 17th, 2006

COSMIC— the Constellation Observing System for Meteorology, Ionosphere and Climate– was successfully launched from Vandenberg Air Force Base in California on Friday night. The AP reports:


Six weather satellites successfully reached orbit and were ready to begin their five-year mission to track hurricanes, monitor climate change and study space weather, it was announced Saturday.

"Ground stations have received signals from all six satellites," according to an update on the Web site for the project’s manager, University Corporation for Atmospheric Research in Boulder, Colo.

The satellites were launched on a rocket booster Friday evening from this Central Coast base. They were placed into orbit about 500 miles above Earth, where they separated to form a chain.

The satellites will take about 2,500 daily measurements by using global positioning receivers to track radio signals passing through the atmosphere, scientists said.

The information gathered will be used to enhance research and improve weather forecasting. Scientists hope the data will help them better track storms and monitor long-term climate change.

The COSMIC web page can be found here


Mars, In Color

Monday, April 10th, 2006

Friday saw the release of the first color image from NASA’s Mars Reconnaissance Orbiter.

ABC News reports:

The crisp test images released Friday revealed pocked craters, carved gullies and wind-formed dunes in Mars’ southern hemisphere. The diverse geologic features show the importance of water, wind and meteor impacts in shaping the Martian surface, scientists said.


The orbiter, the most advanced spacecraft ever sent to another planet, reached Mars on March 10 and slipped into an elliptical orbit. Over the next six months, it will dip into the upper atmosphere to shrink its orbit, lowering itself to 158 miles above the surface.

Last month, the orbiter beamed back the first view of Mars from an altitude of 1,547 miles. Those first test images were meant to calibrate the high-resolution camera aboard the spacecraft. The latest images were taken at the same time, but scientists spent several weeks processing them.

The Reconnaissance Orbiter will begin collecting data in November, and scientists expect the resolution of those images to be nine times higher.

The image is in infrared color– so the colors seen in this post are not what would be seen by the human eye.

 For additional information on the above image, click here.