First Storm of the Season
It’s officially hurricane season and Bertha is gearing up to be the year’s first storm.
Whether you might find yourself in the eye of the storm or you’re just intrigued by extreme weather, you’re sure to appreciate the fun tools that the National Weather Service puts out for the public. This one lets you track the storm’s movements. And this one shows wind speeds.
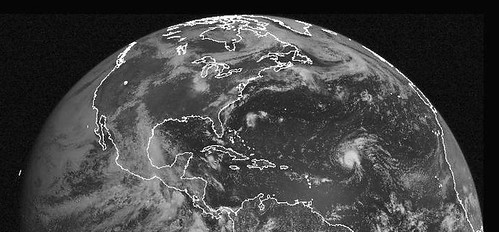
How do they get all the data for these cool images? Why satellites, of course. And the NOAA has a full arsenal. But how does all the information coming from those satellites turn into something we can understand, like this animation of the season’s first hurricane?
With Giovanni it’s simple. And no, that isn’t the name of an Italian tropical storm guru…
Giovanni is actually an acronym for the GES-DISC (Goddard Earth Sciences Data and Information Services Center) Interactive Online Visualization ANd aNalysis Infrastructure.
In other words, it’s a web-based application developed by NASA that is available to anyone with a computer and a bit of spare time. But beware, for those of us who’ve lost hours tooling around on Google Earth, this can become a bit addictive…