Taco Tuesday in Space!
Tuesday, June 9th, 2015Putting together a taco on the ISS is not a simple matter. With mackerel, leek cream, dried tomatoes and quinoa salad? Interesting.
Putting together a taco on the ISS is not a simple matter. With mackerel, leek cream, dried tomatoes and quinoa salad? Interesting.
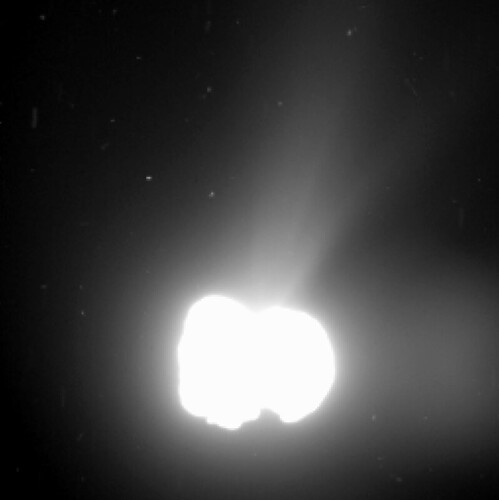
Comet 67P/Churyumov-Gerasimenko activity on 2 August 2014. The image was taken by Rosetta’s OSIRIS wide-angle camera from a distance of 550 km. The exposure time of the image was 330 seconds and the comet nucleus is saturated to bring out the detail of the comet activity. Note there is a ghost image to the right. The image resolution is 55 metres per pixel.
ESA’s Rosetta Mission is sending back some very interesting images, especially for those who were curious about what these big rocks look like. It’s the first spacecraft to rendezvous with a comet.
The one from 7 August 20014 gave us a pretty good close-up…
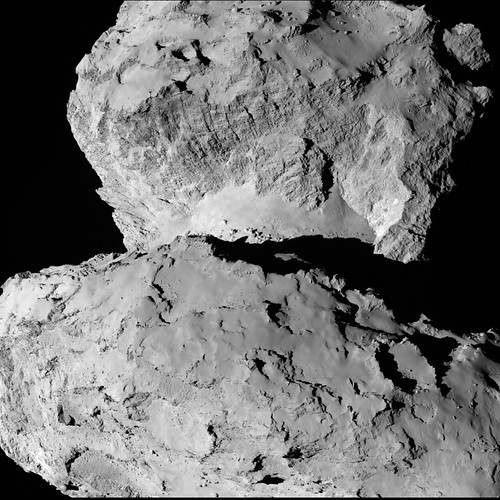
Comet 67P/Churyumov-Gerasimenko imaged by Rosetta’s OSIRIS narrow angle camera on 7 August from a distance of 104 km.
Not as exciting as we’d expect, yet it’s most fascinating.
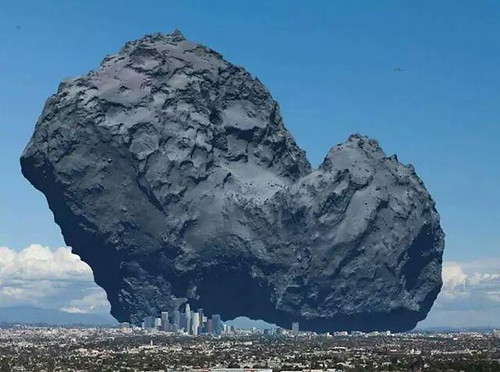
So how big is this comet? Thanks to @quark1972, now we now. Here’s the comet next to Los Angeles.
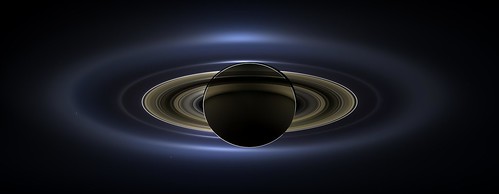
Today marks ten years since the Cassini spacecraft arrived at Saturn. The image above is one of my personal favorites (similar images also available via BigBangPrints.com).
The team of scientists at Cassini have selected their own “top 10” list of images. More importantly, their list of the top ten discoveries is far more impressive…
I love the preview of what we can expect in the coming years…
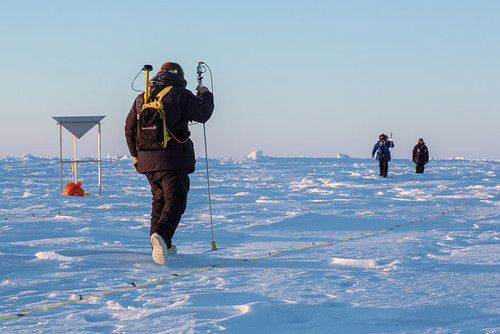
Ah, summer in Greenland. Temparatures in the mid-20’s F and the sun is out — all day. Time to go out and take a stroll.
Let’s verify what Cryosat-2 sees from space. No need to be alarmed. Just follow the little yellow rope back to where you came from.
Meanwhile, on the other side, Antarctica is losing ice at an alarming rate! Read this abstract from Geophysical Research Letters and see what all the fuss is about…
We use 3 years of Cryosat-2 radar altimeter data to develop the first comprehensive assessment of Antarctic ice sheet elevation change. This new dataset provides near-continuous (96%) coverage of the entire continent, extending to within 215 kilometres of the South Pole and leading to a fivefold increase in the sampling of coastal regions where the vast majority of all ice losses occur. Between 2010 and 2013, West Antarctica, East Antarctica, and the Antarctic Peninsula changed in mass by −134 ± 27, −3 ± 36, and −23 ± 18 Gt yr−1 respectively. In West Antarctica, signals of imbalance are present in areas that were poorly surveyed by past missions, contributing additional losses that bring altimeter observations closer to estimates based on other geodetic techniques. However, the average rate of ice thinning in West Antarctica has also continued to rise, and mass losses from this sector are now 31% greater than over the period 2005–2011.
The ESA’s been tracking this for some time and getting something done before summer vacations hit in Europe is an honored tradition.
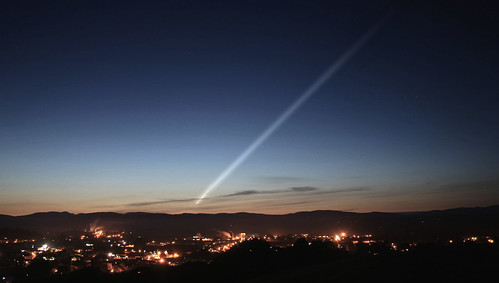
What a treat: we may be able to see the Comet ISON during the Thanksgiving Day holiday. Look for it near the horizon, but don’t look directly into the Sun (duh).
The image above, courtesy of ESA/NASA/SOHO, shows Comet ISON streaming toward the Sun.
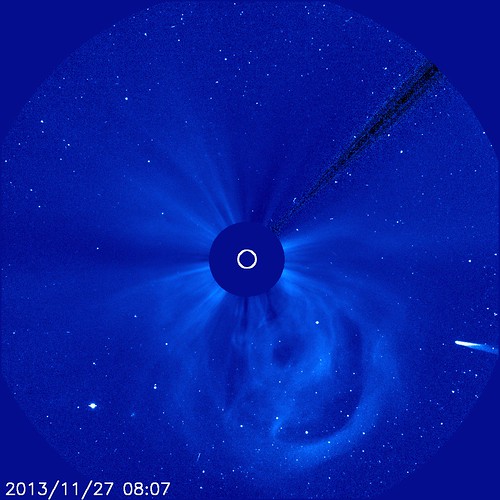
In the early hours of Nov. 27, 2013, Comet ISON entered the field of view of the European Space Agency/NASA Solar and Heliospheric Observatory. In this picture, called a coronagraph, the bright light of the sun itself is blocked so the structures around it are visible. The comet is seen in the lower right; a giant cloud of solar material, called a coronal mass ejection or CME, is seen billowing out under the sun.
Comet ISON, which began its trip from the Oort cloud region of our solar system, will reach its closest approach to the sun on Thanksgiving Day, skimming just 730,000 miles above the sun’s surface.
NASA is tracking Comet ISON’s journey and hosting events to discuss what the public worldwide may see as the comet traverses the sun.
Here’s the best video yet…
Check out NASA’s Comet ISON Toolkit for more.
Think astronomers are excited? That’s an understatement. Look at the observation schedule.
Instruments on the ground or attached to weather balloons give us wind velocity measurements, helping us predict weather changes and forecasting. And they do a pretty good job with it. Anybody with a radio, TV or Internet device can avail themselves of the weather forecast. Or a newspaper. Remember those?
Although I appreciate being able to know what the weather will be like after tomorrow or next week, I long for the days when we would simply look toward the sky, feel the wind and/or humidity and make an experienced guess on the next day’s weather. Winds from the south and we’ll get rain. Chilly wind from the northwest indicates a change toward colder days ahead.
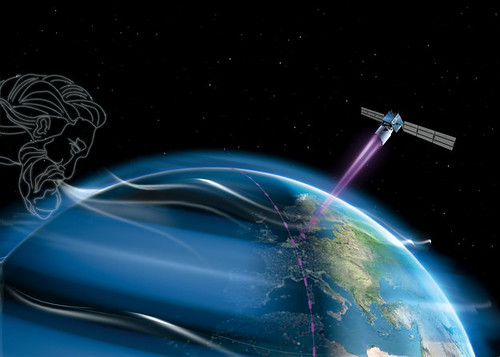
If the wind makes a difference on the ground, think about what it would mean if we were able to use an instrument in space. Enter the ESA’s Aeolus mission, which includes the Aladin UV laser instrument.
The Aeolus satellite will carry a single, but complex, instrument that will probe the atmosphere to profile the world’s winds. Reliable and timely wind profiles are urgently needed by meteorologists to improve weather forecasts. In the long term, they will also contribute to climate research.
Aeolus carries a pioneering instrument called Aladin that uses laser light scattering and the Doppler effect to gather data on wind.
The laser generates high-energy UV light, which is beamed towards Earth through a telescope. As the light travels down through the atmosphere, it bounces off molecules of gas, particles of dust and droplets of water.
By comparing the shift in frequency of the received light from the transmitted light caused by the Doppler effect, the motion of the molecules in the atmosphere can be measured, revealing wind velocity.
The laser transmitter is being developed by Selex-ES in Italy.
It has been a very long and difficult undertaking – forging new technologies in many areas such as optics, opto-electronics, precision mechanics and thermo-mechanical design.
Recent tests show all this effort has not been in vain.
Throughout three consecutive weeks, the laser transmitter remained perfectly stable at full energy, producing a total of 90 million UV laser shots.
Considering that each shot is 5 MW, peaking at an intensity similar to that of a lightning strike and that this is repeated 50 times a second – the stress on the optical components that shape and guide the laser beam is tremendous.
Predicting weather and climate changes using a space-based UV laser. Cool.
Soyuz lifts off for the first time from Europe’s Spaceport in French Guiana, carrying the first two Galileo In-Orbit Validation satellites.
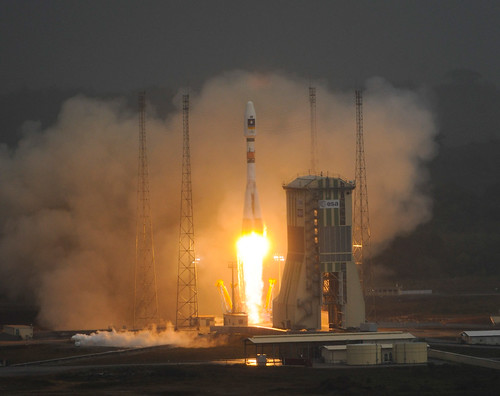
Watch the full video here.
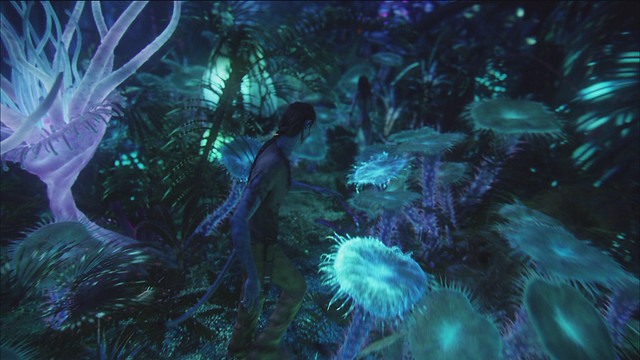
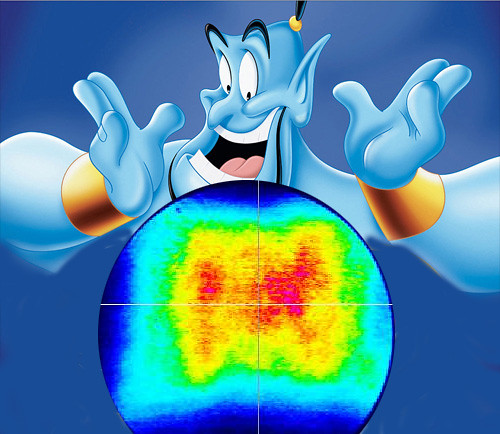
One of many interesting, fantastic details of the film “Avatar” was the bioluminescent plants — and the inter-networked biosystems on Pandora.
Why am I thinking about this? NASA just released details of maps illustrating land plant fluorescence, based on the work of several scientists who published “First observations of global and seasonal terrestrial chlorophyll fluorescence from space.” The abstract:
Remote sensing of terrestrial vegetation fluorescence from space is of interest because it can potentially provide global coverage of the functional status of vegetation. For example, fluorescence observations may provide a means to detect vegetation stress before chlorophyll reductions take place. Although there have been many measurements of fluorescence from ground- and airborne-based instruments, there has been scant information available from satellites. In this work, we use high-spectral resolution data from the Thermal And Near-infrared Sensor for carbon Observation – Fourier Transform Spectrometer (TANSO-FTS) on the Japanese Greenhouse gases Observing SATellite (GOSAT) that is in a sun-synchronous orbit with an equator crossing time near 13:00 LT. We use filling-in of the potassium (K) I solar Fraunhofer line near 770 nm to derive chlorophyll fluorescence and related parameters such as the fluorescence yield at that wavelength. We map these parameters globally for two months (July and December 2009) and show a full seasonal cycle for several different locations, including two in the Amazonia region. We also compare the derived fluorescence information with that provided by the MODIS Enhanced Vegetation Index (EVI). These comparisons show that for several areas these two indices exhibit different seasonality and/or relative intensity variations, and that changes in fluorescence frequently lead those seen in the EVI for those regions. The derived fluorescence therefore provides information that is related to, but independent of the reflectance.

Real science is never too far from science fiction, is it?
That reminds me: I should water the garden.
